
Scouting freshmen is one of the hardest things you can attempt in fantasy football – or so they say…. There are two main reasons I’ve never been someone that defaults to film in their scouting:
-
I wasn’t born in the US, nor did I grow up there, nor do I live there now. This means that I’ve never played the game, and given Sunday NFL games start being telecast at 3 a.m. in the morning for me, it’s even difficult to regularly be exposed to actual live games too. Therefore, if I was to evaluate based on film – I couldn’t be confident I’d ever have any idea what I was looking at!
-
Watching film is time-consuming. Data, on the other hand, allows you to comb through every single player much more quickly and objectively.
Modeling Approach
Using data sourced by our local Recruiting expert @bigWRguy, I created three different models aiming to predict College Football Fantasy Points per Game for incoming Freshmen Wide Receivers. I then averaged the results of each of the models on the same scale to come up with each player’s final score. Averaging of multiple models can be used when there’s increased uncertainty, and therefore it’s based on the premise that some models will overestimate results, and some will underestimate results. This is also one way to try and avoid over fitting, which would lessen the predictive nature for testing datasets and future datasets. It is important to note that given how hard it is to find information on high school players, the dataset doesn’t have every single player from every recruiting class, however, it does have a significant amount! And certainly, enough to be helpful in trying to make future predictions.
Data was split into a training set comprising of 70% of the data, and the remaining 30% was used to test the model. Only players who had a minimum of three seasons of College football played were included in the model creation process – this meant that recruiting classes 2016-2020 were used.
Five themes of variables were used across the three models:
-
Recruiting grades
-
Peak Miles Per Hour on tape
-
High School Production
-
High School Enrollment size as a proxy for local talent levels
-
Age on National Signing Day
Where a variable was missing for a player, then they were allocated the average for that variable.
Results
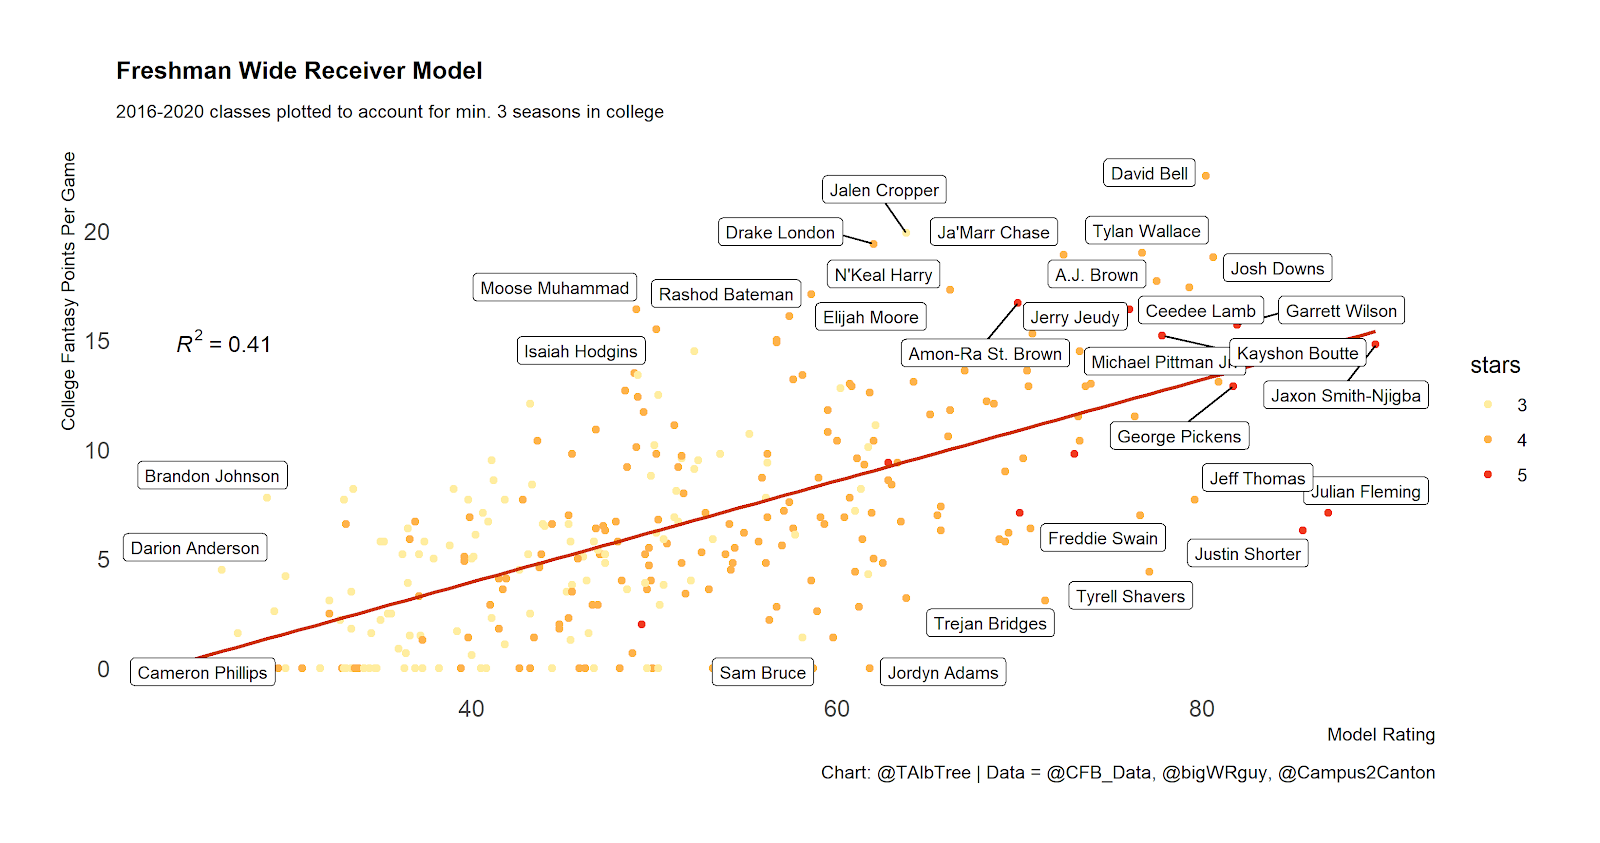
The R-squared correlation for the whole dataset (training + testing) from 2016-2020 was 0.41. This means that the model score was able to explain 41% of the variation in College PPG. This is much higher than I thought it would be, especially considering the 247 Composite rating only has roughly a 0.14 R squared to College PPG. When I used a single linear regression model last year, even including the training data, the R squared ranged from ~0.2-0.28 depending on the sample tested. 2021 and 2022 classes were not included in the training of the model, given only having one or two years of college production and have promising results being returned already with the R squared in the 0.16-0.20 range when testing those classes individually. So, in conclusion, this is a model I’m happy to trust (at least more than I’d trust my eyes with film anyway).
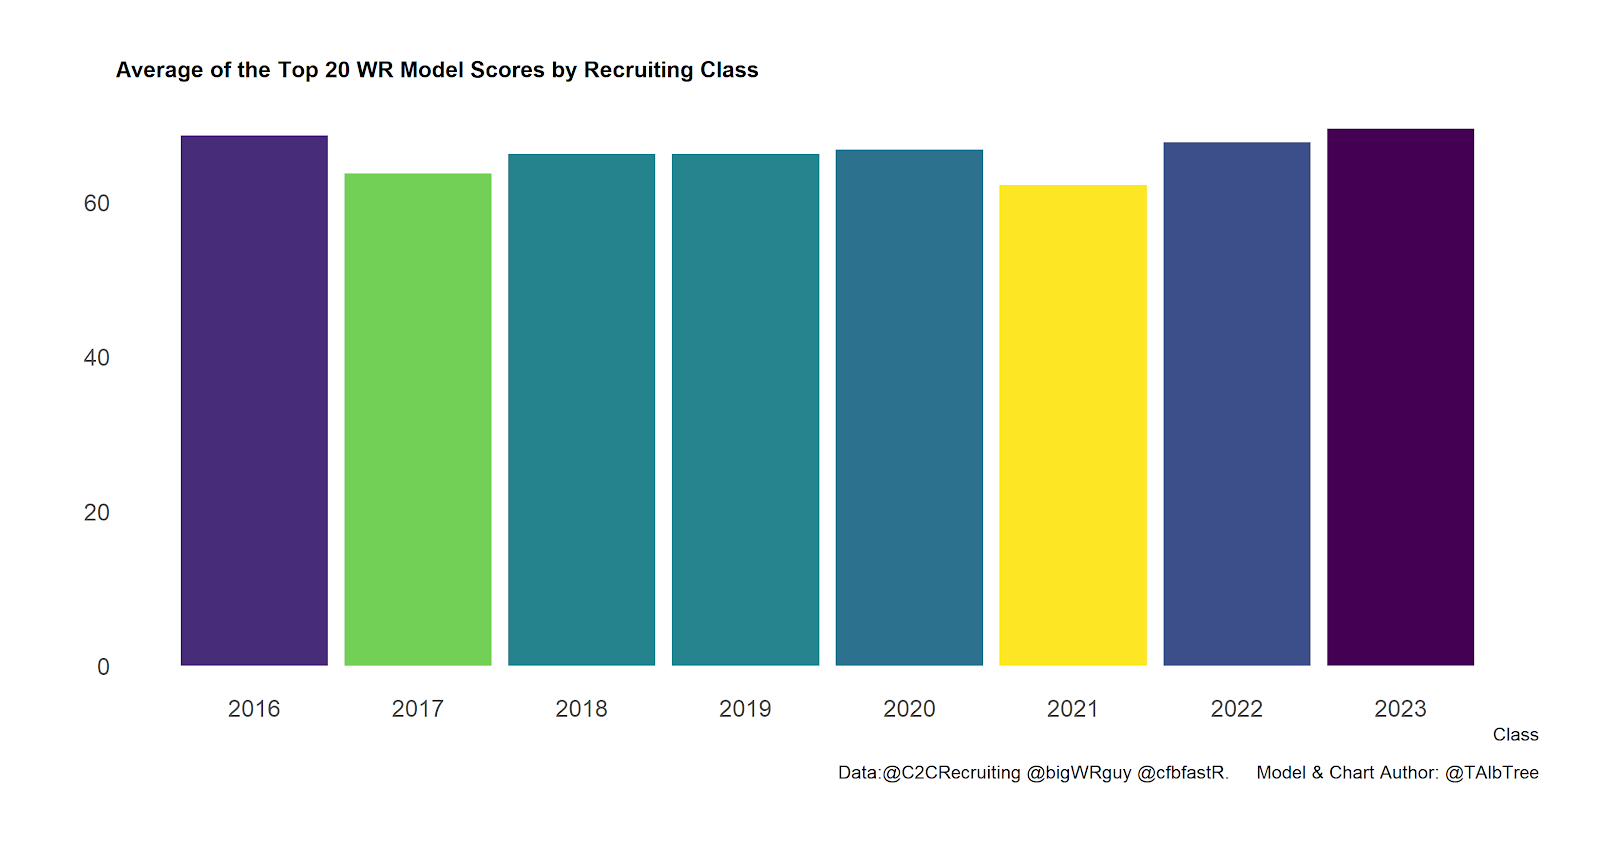
When compared by the average of the top 20 model scores per year, this year is projected to be the strongest year of the past eight years, followed by 2016, then 2022, with 2021 being the weakest.
All Time Model Scores

Above is a glimpse of the top 20 scores recorded in the database, which is from 2016 onwards. We have some hits, and some misses. However, when you account for some of the hits whose composites weren’t in the >0.980 range (Pittman, Downs, Bell, Lamb) is when I truly appreciate this model. After all, getting studs at cheaper costs is the name of the game in every single level of fantasy football that we play – from C2C freshman redrafts all the way through to NFL redraft.
Model Scores for 2023
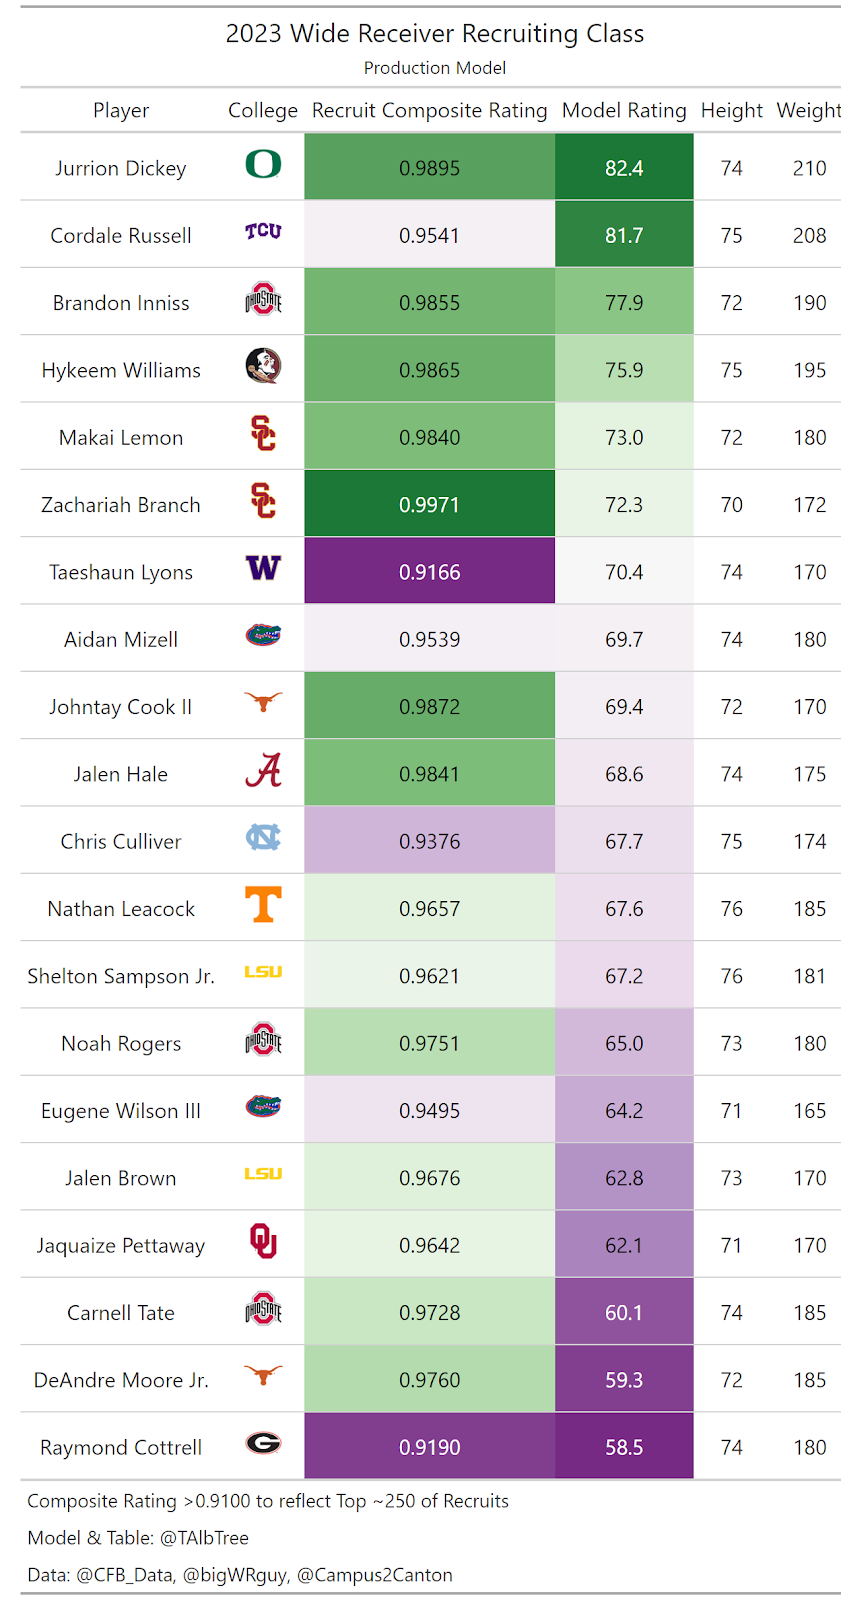
Jurion Dickey and Cordale Russell have posted elite scores over 80. From 2016 onwards only 8 other freshman WRs hit this mark, with only Julian Fleming and Justin Shorter not panning out.
Compared to the consensus Campus2Canton freshman WR rankings this model is much higher on Hykeem Williams (C2C WR13), Taeshaun Lyons (C2C WR23), Aidan Mizell (C2C WR21), Chris Culliver (C2C WR22), and Nathan Leacock (C2C WR17). On3 are similarly fans of Leacock (On3 WR6) and Mizell (On3 WR11).
Whereas the model is lower on Johntay Cook (C2C WR2), Jaden Greathouse (C2C WR7 vs Model WR32), Shelton Sampson Jr. (C2C WR9), and Carnell Tate (C2C WR10).

Although the model is designed for players with a composite rating greater than 0.9100 to roughly reflect the top 250 ranked players and the great drop-off in success rates after this point, I do understand the level of degeneracy that C2C leagues calls for. The above table has the players below a composite rating of 0.9100. Remember my name when Tiger Bachmeier is a star!
As always, if there are players you don’t see here, then please don’t hesitate to reach out to me on Twitter or on the Campus2Canton discord.


